Understanding the best carbon reduction approach for industrial enterprises
Estimates can vary depending on what’s included, but approximately 51% of global emissions come from the industrial sector. This figure is one that motivates our team of industry, software, and carbon experts everyday to understand the challenges of the world's largest enterprises with some of the most complex supply chains.
While corporate understanding of emissions is still relatively new, both accounting and sustainability professionals have been familiar with LCA and Carbon Accounting for many years. These approaches are both relevant to corporate sustainability but were initially designed for different use cases. Life cycle assessment (LCA) is used to assess the environmental impacts of product systems and decisions, often driven by customer requests or regulatory requirements. Meanwhile, Carbon Accounting measures how much carbon dioxide (and CO2 equivalents) an organization emits and often fulfills requirements for non-financial reporting. This form of accounting was mostly developed in the last two decades with the intent of providing a factual basis for carbon-conscious decision-making. However, it's true efficacy until recently is unclear, given that companies had often based their carbon accounting on speculative upstream and downstream emissions (Scope 3). This means that with inaccurate information – but good optics – carbon accounting has been strongly driven by publicly listed companies for reporting purposes and not for decision-making.
LCA was developed for a highly granular assessment of environmental impacts – which makes for reliable carbon footprint models. These assessments require complex data collection processes, involving a high level of manual entry as well as low level of technical innovation. Traditionally, these models were created externally through specialized consultancies or internally by LCA experts with a background in environmental engineering. Carbon Accounting has a fairly simple data collection process that can consist of information such as energy bills, vehicle mileage, or company facility needs, for example. But as this information doesn’t provide the full scope of a company’s activities or supplied goods, it is not useful when it comes to reduction planning and decision-making (beyond participating in the voluntary carbon market to buy carbon credits which is not ‘ultima’ ratio for energy-intensive industries). This is especially the case for industrial companies that rely on processes like assembly, smelting or those with extensive supply chains. Beyond that, frameworks for carbon accounting are very broad when it comes to database and methodology choices, which has often been exploited by companies that have only felt compelled to do the bare minimum in regards to time and resource allocation.
If we stand a chance of decoupling economic growth from emissions we need precise data and reliable processes. While addressing Scope 1 and Scope 2 emissions has been the low-hanging fruit for many companies, Scope 3 still needs to be urgently addressed and is now re-emerging as an urgent topic. Fortunately, the U.S. Securities and Exchange Commission, European Commission, and other governing bodies understand the importance of a net-zero future and are now mandating companies to disclose the carbon footprints of their entire value chains, from end-to-end. When it comes to transforming into a net-zero enterprise, companies are finding it challenging to navigate which approaches are best for them to comply with established and new regulations – and understandably find it challenging to understand the current market stance. If that wasn’t complicated enough, there’s also the question of determining whether a Product Carbon Footprint is enough for their reporting and compliance needs, or if what they need is to have a holistic measurement of their entire Corporate Carbon Footprint, but that’s another topic for another day…
Most enterprises face similar obstacles when it comes to their net-zero transformation:
- Lack of focus, with little to no clarity on emissions hotspots
- Scattered data located across several different ERP and production systems
- Managing massive amounts of data, especially in Scope 3 (this includes purchasing transactions, BOMs and supplier data)
- Dynamic decision-making supported by forecasting and reduction tracking
- Understanding the financial link between carbon optimization and ROI
- Execution of SBTI Targets and Net-Zero Strategy
Knowing the ins and outs of this breakdown is crucial to understanding which methodology is right for a company’s decarbonization strategy and it’s also how carbmee supports the world's largest companies to reduce their carbon emissions with one LCA-based, end-to-end carbon management solution, that puts companies in control of their net-zero transformation.
I’d like to dig a bit deeper into differences within LCA and Carbon Accounting:
Spend-Based Vs. Activity-Based Calculations
Spend-based
The spend-based methodology utilizes environmentally extended input-output (EEIO) databases to calculate emission factors for different materials from different regions. These factors are based on spend and have the unit kg COv2e/€.
Activity-based
The activity-based methodology uses an LCA approach, where emission factors rely on LCI databases and are calculated with the method recommended in the GHG protocol to arrive at global warming potentials for different materials and services. For the activity based approach, ecoinvent models are used as they are, without further changing them. They are chosen based on their best fit to the used materials or services.
Supplier-specific
The supplier-specific approach works the same way as the activity-based one, but here generic data from the database is replaced by or enriched with primary data from the customer or supplier. This allows to not only calculate emissions more accurately, but also to recommend to-dos to achieve emission reductions.
Example for Spend-Based Calculations
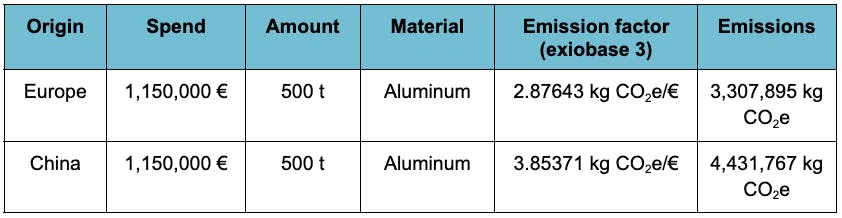
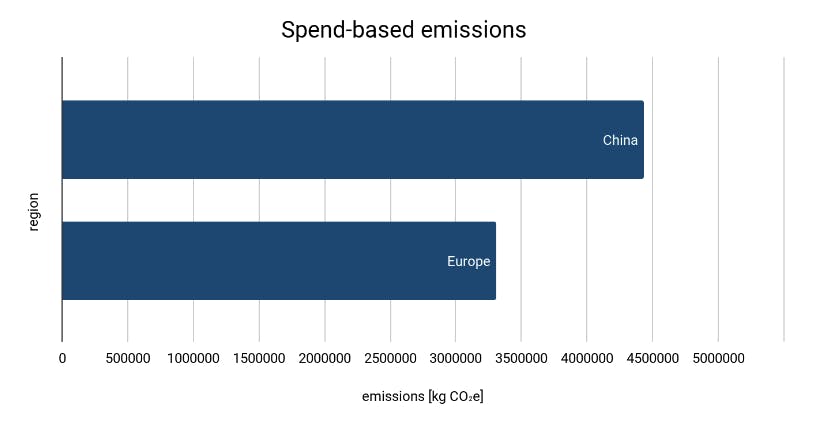
A manufacturing OEM is doing a spend-based analysis of their Scope 3 Emissions, based on spend data. They purchased 500 tonnes of Aluminium for their production process on the 2nd of September 2022, from both a Chinese and a European supplier. Each time, they paid a price of 2,300 €/tonne, which amounts to 1,150,000 €.
The resulting footprint is 3,307,895 kg CO2e for the European supplier and 4,431,767 kg CO2e for the Chinese supplier, due to different energy mixes in the regions.
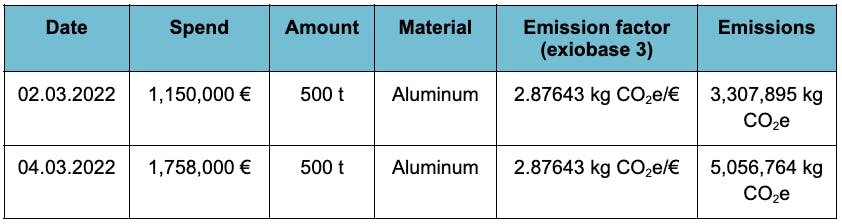
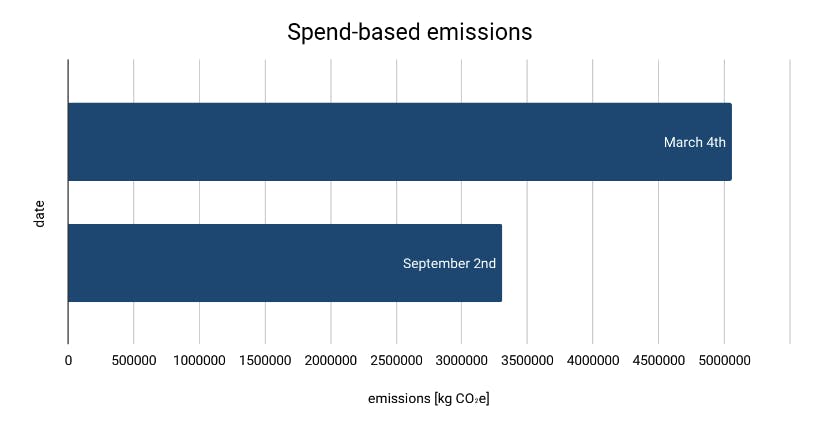
The same company bought the same amount of Aluminium from their European supplier on the 4th of March 2022, and paid a price of 3,516 €/tonne, which amounts to 1,758,000 €.
The resulting footprint is 5,056,764 kg CO2e.
The drawbacks of the spend-based approach are:
a. that these calculations can't be broken down into material, transport, production steps, energy consumption - so ultimately, it's not designed to identify reduction paths or go deep along the entire value-chain.
b. and the inaccuracy that can come from material price fluctuations & negotiation processes, so spend can change dramatically, even though consumption is steady.
Example for Activity-Based Calculations
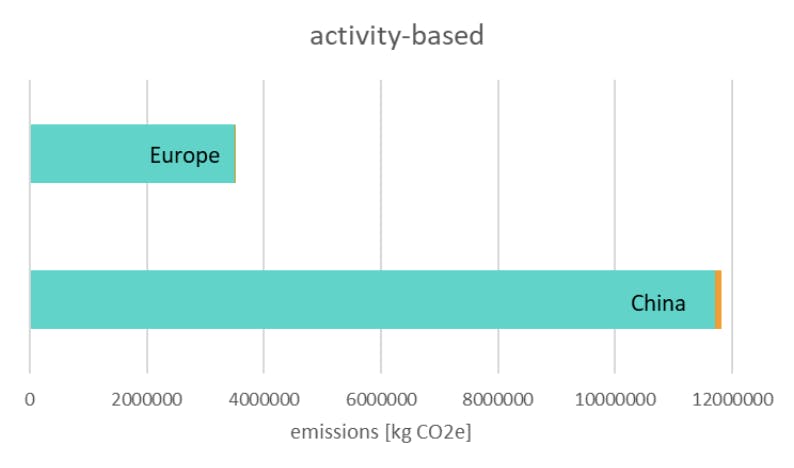
A manufacturing OEM is doing an activity-based calculation of their Scope 3 Emissions, based on purchasing transactions (volume + material) and transport method. 500 t of Aluminium are purchased from Europe and China.
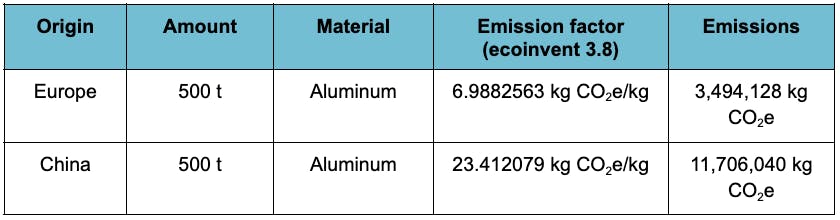
The European material is transported by truck for 500 km, the material from China by ship (22,000 km) and then by truck (300 km).
The OEM receives a footprint represented by the following graphic, with transport emissions are depicted in orange, and material in turquoise.
Advantages to spend-based calculations include that they:
1. can be broken down into material, transport, production, energy down to tier-n;
2. can differentiate suppliers in different countries, including transport;
3. can be flexibly designed to deep dive with supplier data once a hotspot is identified;
4. and are very accurate and designed to plan reduction initiatives with it.
Limitations:
The emission factor is derived from the ecoinvent database and includes generic assumptions about the production steps and energy sources that are used for the aluminum production, based on local grid mixes. This does not allow for recommending reduction steps to specific suppliers, because their respective production methods are not taken into account.
Example for Supplier-Specific Calculations
By getting primary data from the supplier of the material, it becomes possible to identify hotspots in the production and recommend meaningful reduction measures. For the example of aluminum, it can look like this:
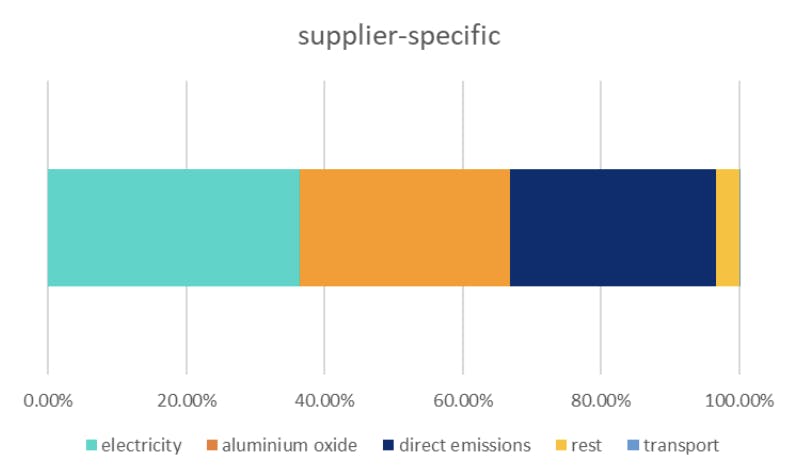
It becomes clear that a significant share of the emissions from aluminum are caused by electricity consumption during fabrication – that is creating the raw material aluminum oxide – and direct emissions during physical processing. This gives the supplier three levers to reduce emissions that were previously unknown, such as: switching to renewables, changing the sourcing of the raw material, or capturing emissions where they occur.
How carbmee can help
carbmee offers an automation layer on top of companies' ERP and manufacturing systems to streamline data and mapping them with LCI emission factors to build highly complex activity-based LCA models at scale.
This automation layer is purpose-built for companies with complex supply chains and high technical complexity with thousands of suppliers and materials as well as millions of transactions.
For companies serious about not only measuring their emissions according to the science-based standards, but reducing them too, you should consider using a platform that uses activity-based calculation. carbmee EIS™ Carbon Management solution uses a category-defining data model that allows companies to significantly increase the granularity in hotspot identification, which ultimately enables carbon reduction at scale.
To experience precise and powerful carbon management, book a demo to test out our solution for yourself.