Did You Know You Can Quantify Carbon Cost Exposure Across Your Supply Chain with Carbmee EIS?
Carbon is no longer just a sustainability metric. It is becoming a cost driver, a supplier risk signal, and a profitability factor.
The World Bank reports that direct carbon pricing now covers nearly 30% of global greenhouse gas emissions, while the EU’s Carbon Border Adjustment Mechanism entered its definitive regime in 2026, linking certain import-related carbon costs to EU ETS allowance prices. At the same time, McKinsey notes that Scope 3 emissions typically represent the majority of corporate emissions, often sitting outside a company’s direct control and requiring supplier collaboration to manage.
For procurement, finance, sustainability, and supply chain teams, the question is no longer: “Can we report our emissions?” It is: “Can we see where carbon costs are hiding before they affect supplier negotiations, product margins, and risk exposure?”
Why carbon cost exposure matters now
Buyers and decision-makers are increasingly asking questions like: How do you calculate carbon cost exposure in procurement? How does internal carbon pricing affect supplier decisions? Which suppliers create the highest carbon risk?
These questions matter because much of a company’s climate impact sits outside direct operations. McKinsey explains that Scope 3 emissions occur across the value chain and are not directly controlled by the company, which means companies need to engage suppliers, distributors, and customers to reduce them.
That makes carbon cost exposure a commercial issue. If a supplier, material, or region carries a higher emissions footprint, that exposure can translate into future cost, regulatory complexity, or reduced product profitability. Without a granular view, companies risk making sourcing decisions based only on today’s purchase price, while missing tomorrow’s carbon cost.
How to quantify carbon cost exposure across your supply chain
- Map your procurement and supplier data
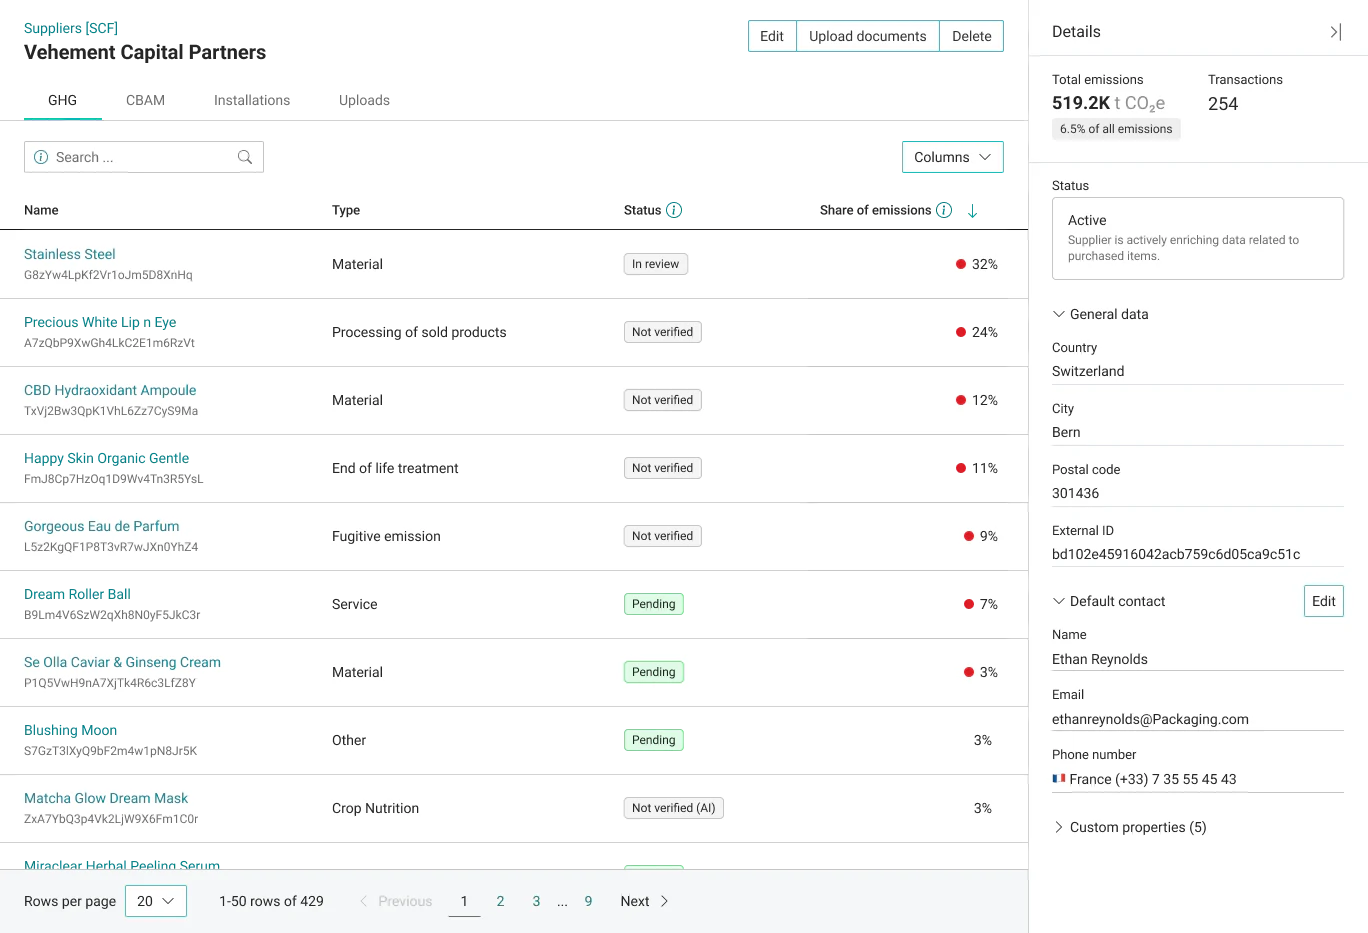
Start by connecting the data you already have: ERP transactions, supplier records, material codes, product categories, volumes, locations, and spend. The goal is to create a usable carbon data foundation across products, sites, suppliers, and transactions. - Build a supplier- and product-level emissions baseline
Carbon cost exposure cannot be managed at company-average level. You need to understand emissions at the level where decisions happen: supplier, SKU, material, component, shipment, and product line.
- Apply relevant carbon price scenarios
Next, model exposure using applicable carbon pricing mechanisms, such as CBAM, EU ETS-linked scenarios, regional carbon pricing schemes, or an internal carbon price. This helps teams answer: What happens to landed cost if carbon prices rise? Which suppliers become more expensive when carbon is included? - Identify carbon cost hotspots
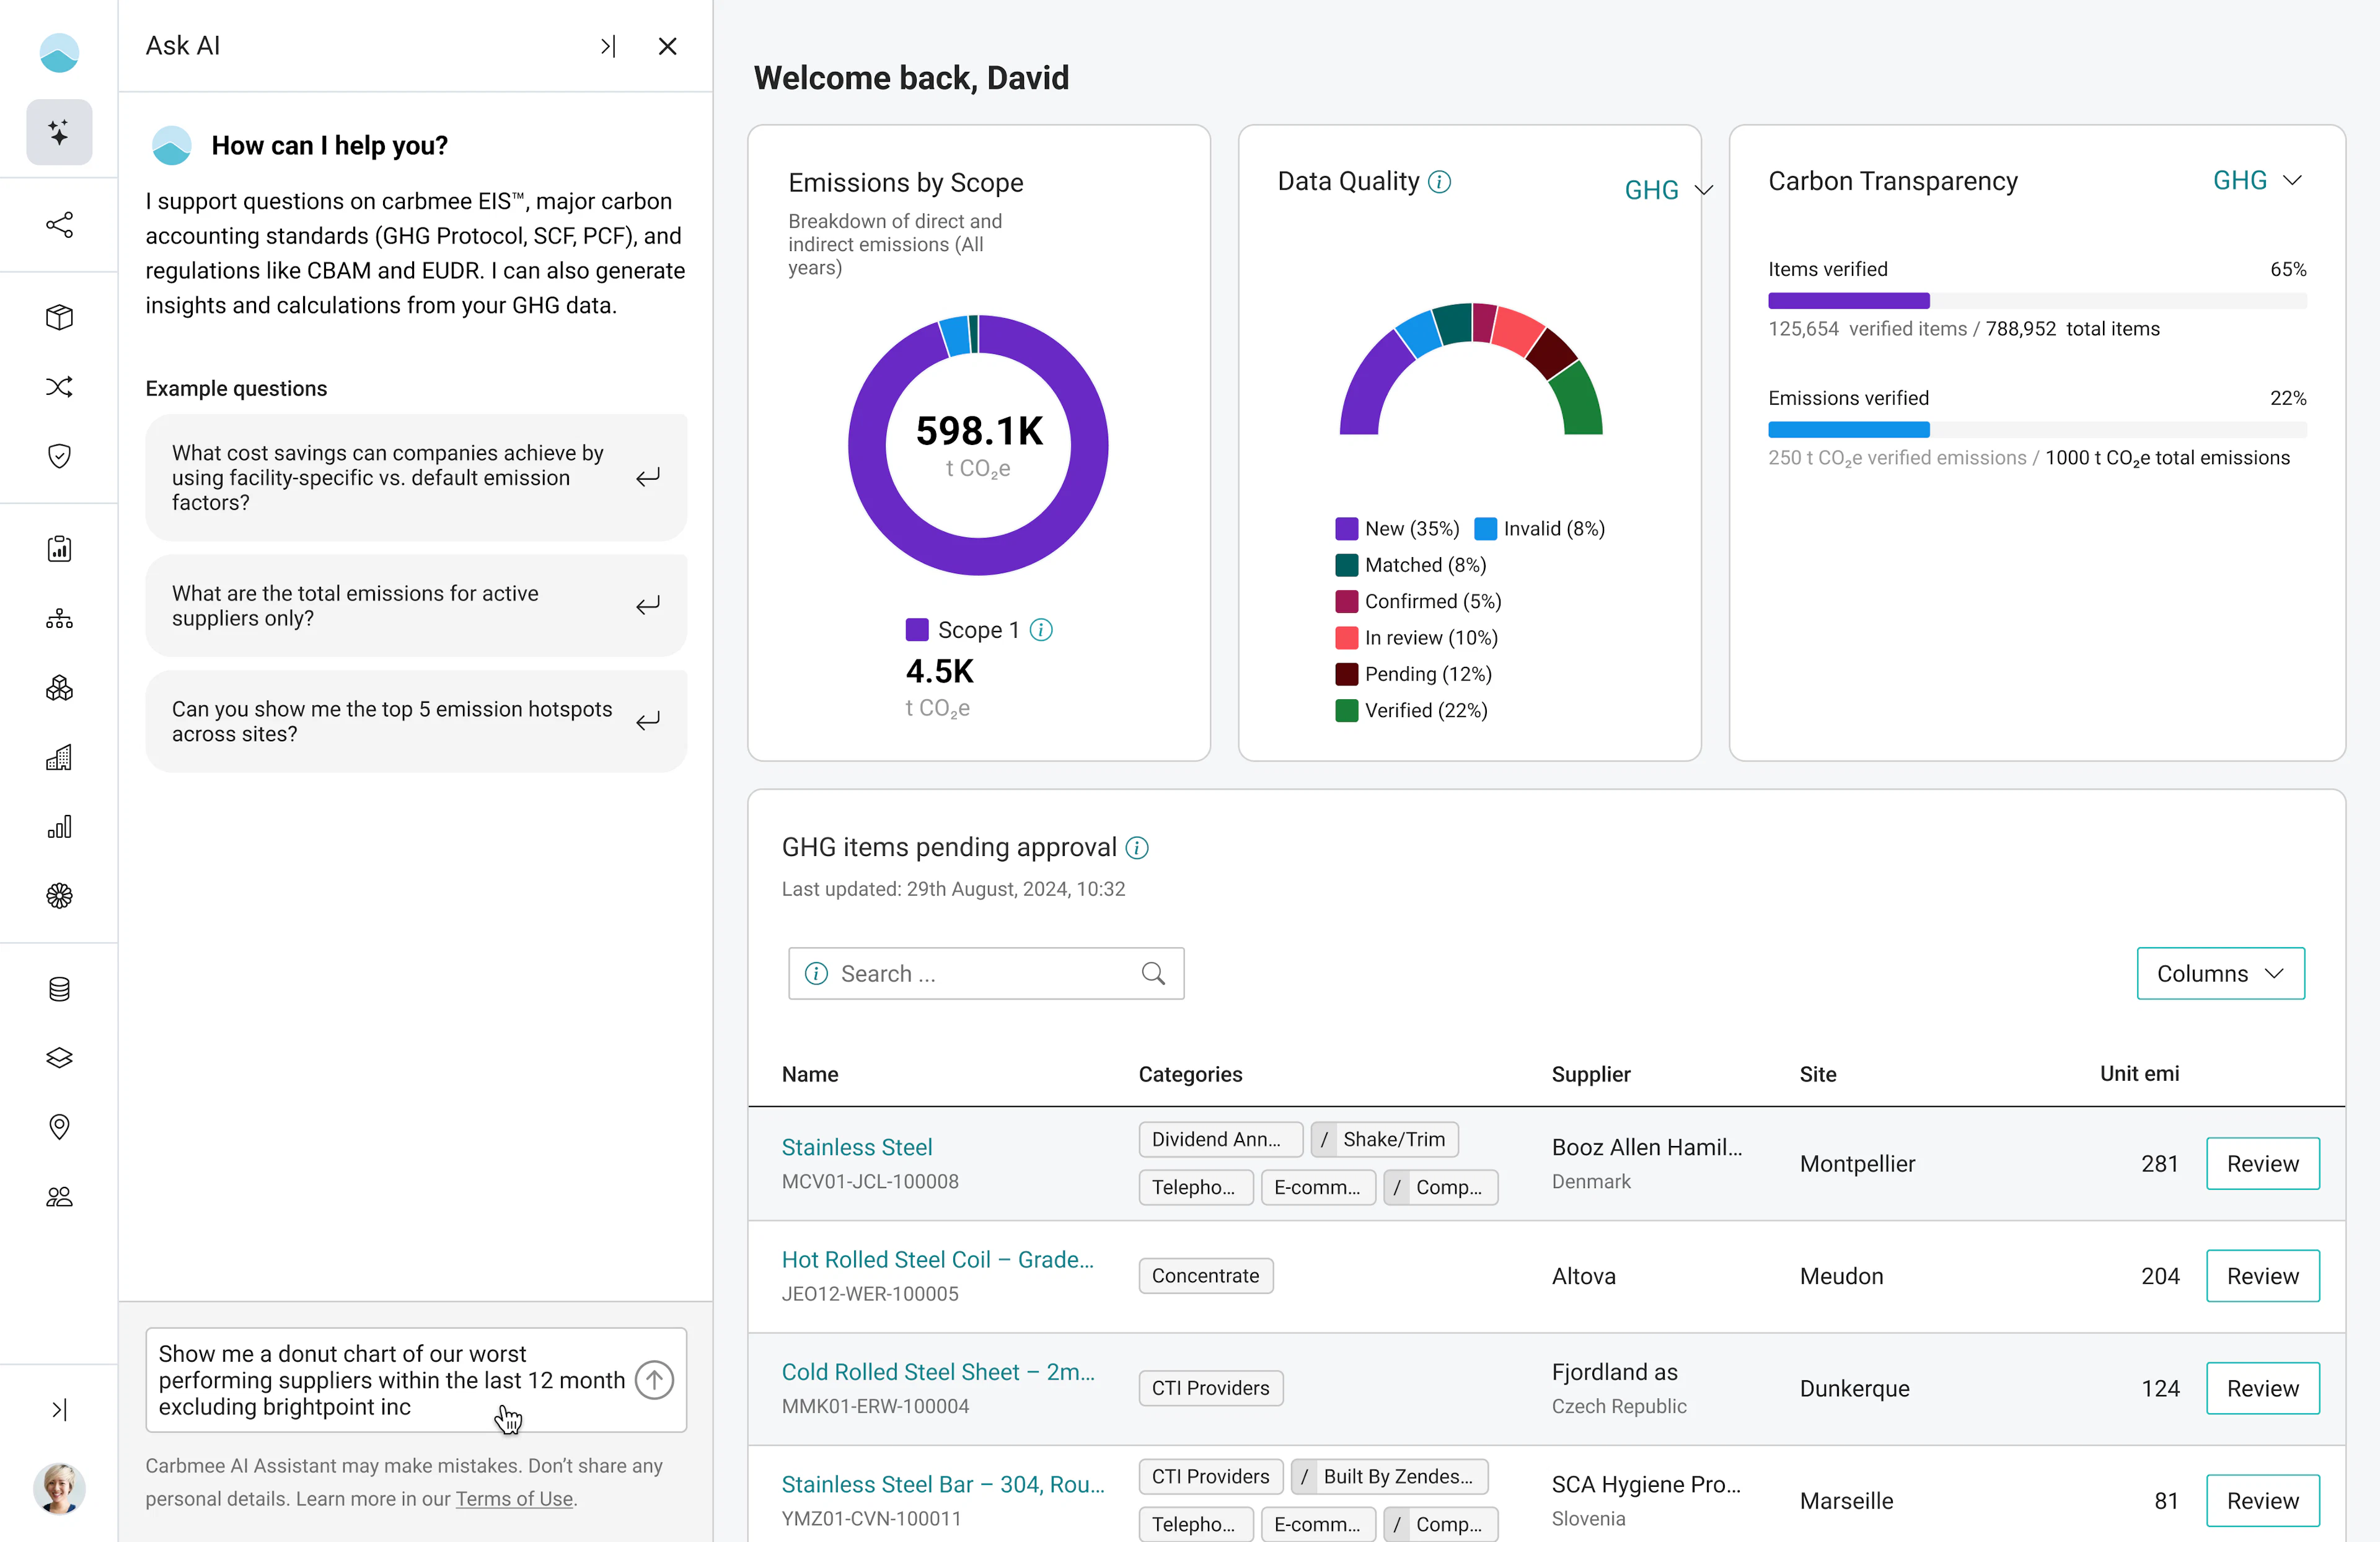
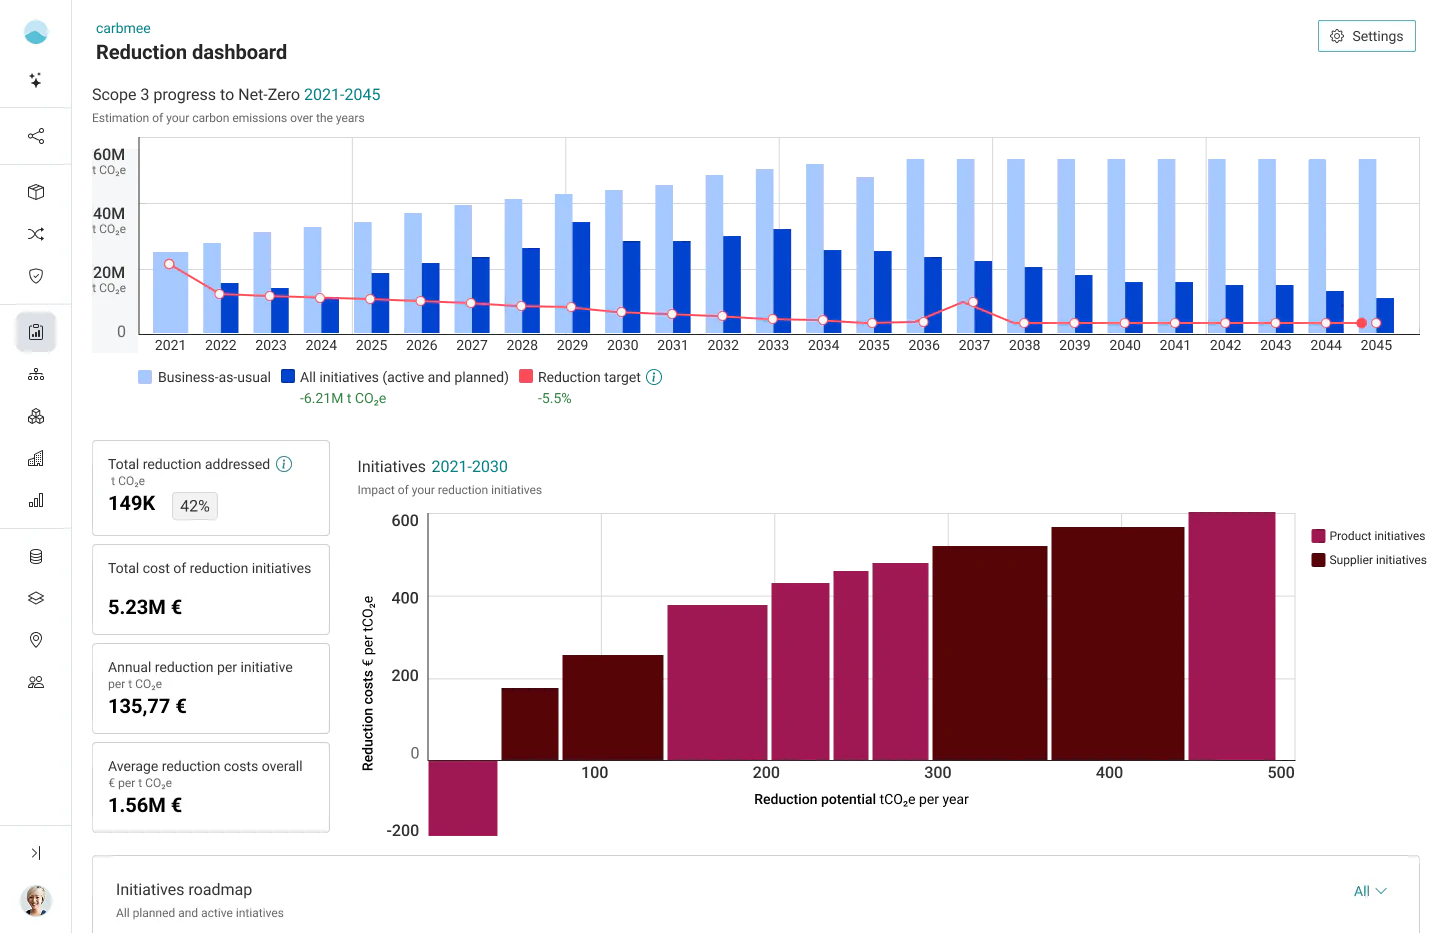
Once emissions and cost scenarios are connected, procurement can rank suppliers, materials, and categories by exposure. Carbmee EIS™ supports this type of business-focused environmental intelligence by helping procurement identify supplier hotspots and carbon cost exposure, while finance can model abatement costs and simulate scenarios.
- Use carbon cost in sourcing decisions
Supplier comparison should go beyond price, quality, and delivery. By including carbon cost exposure, procurement can compare bids more strategically and understand the future financial risk of high-emission options. - Connect exposure to product profitability
Carbon-intensive materials can affect product-level margins, especially in regulated or carbon-sensitive markets. Quantifying exposure helps product, finance, and sustainability teams understand where redesign, supplier switching, or decarbonization initiatives could protect profitability.
- Turn insights into supplier action
The final step is collaboration. Once hotspots are clear, companies can engage suppliers with targeted requests, reduction roadmaps, and data-backed business cases instead of broad, manual questionnaires.
How Carbmee helps
Carbmee EIS™ connects products, sites, supply chains, and transactions to transform environmental data into strategic business insight with Profit & Loss impact beyond compliance. The platform includes integrated Scope 1, 2, and 3 carbon management, supplier collaboration at scale, scenario modelling, carbon cost forecasting, and financial integration.
With Carbmee EIS™ Studio, teams can apply carbon pricing models to evaluate emissions cost exposure, assess supplier carbon scores, integrate ERP material codes, and use marginal cost abatement curves to prioritize low-cost emissions reduction opportunities.
From procurement data to carbon cost savings: Galp’s story
Galp used Carbmee EIS™ to transform procurement data into emissions intelligence. Carbmee analyzed Galp’s 2024 supply chain across approximately 40,000 items, more than 2,000 suppliers, and 140 categories. A focused “What If” analysis on selected tenders revealed up to €13M in quantifiable carbon cost savings, driven primarily by a 78% emissions reduction potential in services tenders.
For enterprises in Europe and the US, this is the next step in carbon management: not just reporting what happened, but forecasting what carbon could cost and using that intelligence to make better procurement, risk, and profitability decisions.
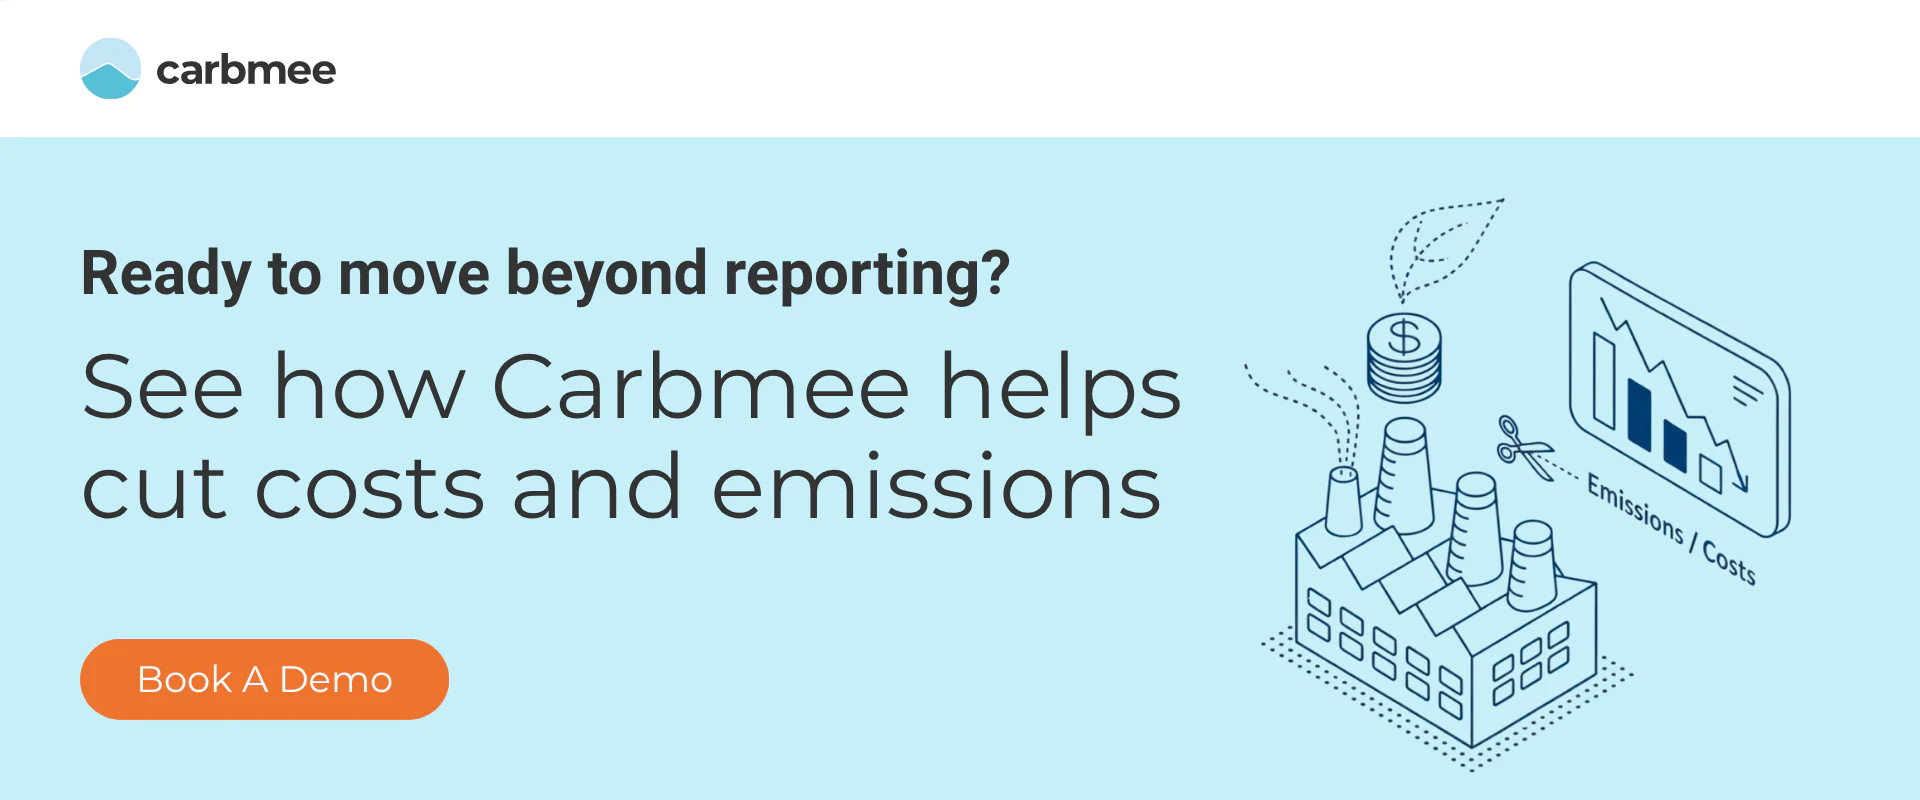
Ready to understand where carbon costs are hidden in your supply chain? Book a Carbmee EIS™ demo and see how carbon cost exposure can become a lever for smarter procurement, lower risk, and stronger product profitability.