Carbon Footprint: Definition, Drivers in Industry, and How Manufacturers Can Reduce Emissions at Scale
Companies are under growing pressure to measure, disclose, and reduce emissions across their operations and value chains. Customers increasingly ask for supplier emissions data and product carbon footprints. Investors and regulators expect credible plans backed by measurable progress. Internally, leaders need a clear view of where emissions come from so they can prioritize the highest-impact levers, fund the right projects, and prove results.
A carbon footprint is most useful when it becomes a management tool rather than a reporting exercise. For industry, that means connecting emissions to plants, processes, materials, products, and suppliers. It also means building a repeatable system that can handle thousands of purchase orders, hundreds of sites, and complex product portfolios without becoming a spreadsheet burden.
We explain what a carbon footprint is, what drives it in industrial settings, and how manufacturers can reduce it with a practical, prioritized approach. It also clarifies the differences between corporate carbon footprints, product carbon footprints, and life cycle assessment.
What Is a Carbon Footprint?
A carbon footprint is the total amount of greenhouse gas emissions associated with an activity, organization, product, or process, expressed as carbon dioxide equivalents (CO2e). CO2e is used so that gases like methane and nitrous oxide can be compared using a common unit based on their warming impact. For industrial companies, a carbon footprint is typically calculated over a defined period, such as a calendar year, and broken down into categories that reflect how emissions occur across operations and the value chain.
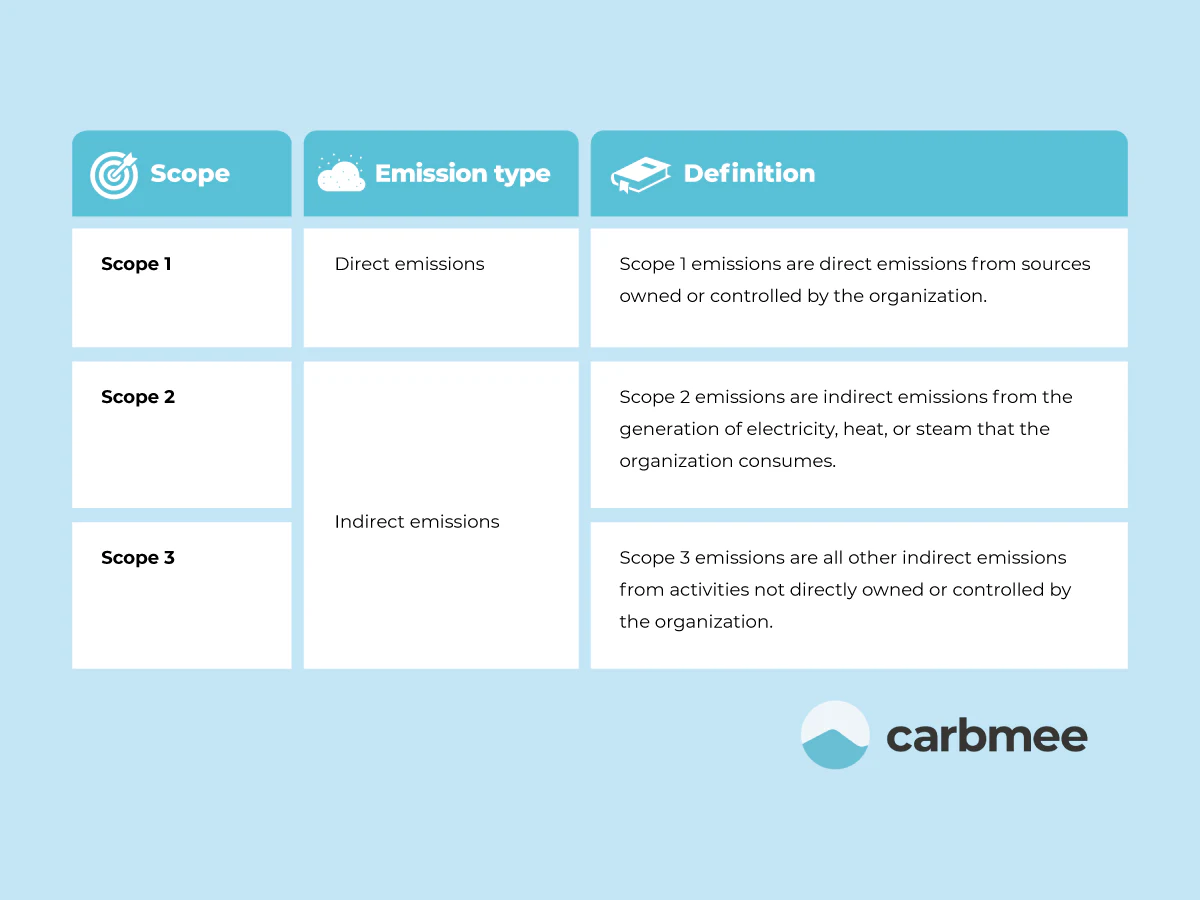
Most companies structure their corporate carbon footprint using a three-scope approach. Scope 1 includes direct emissions from sources a company owns or controls, such as on-site fuel combustion and certain industrial processes. Scope 2 covers indirect emissions from purchased electricity, steam, heating, or cooling. Scope 3 includes other indirect emissions across the value chain, often the largest portion for manufacturers, including purchased goods and services, upstream transportation, waste, business travel, and downstream activities depending on the business model. In practice, the corporate footprint becomes actionable only when it is translated into operational detail, such as emissions by site, by energy source, by material category, and by supplier segment.
Why carbon footprints matter for industrial and manufacturing companies
For many manufacturers, emissions performance has become a commercial requirement. Large customers use supplier emissions data to calculate their own corporate and product footprints, and they increasingly embed sustainability criteria into sourcing decisions. A credible footprint helps a supplier respond to questionnaires, meet tender requirements, and support long-term customer relationships. It also reduces risk by preparing the organization for changing reporting expectations and by highlighting dependencies on carbon-intensive inputs.
A strong footprint program also improves internal decision-making. When emissions are tied to production volumes, energy use, scrap rates, and procurement categories, operations teams can identify where decarbonization projects will have the strongest effect. Finance teams can compare projects using consistent metrics, and leadership can track progress against targets without relying on fragmented estimates. Over time, this creates a closed loop where measurement supports prioritization, prioritization drives investment, and investment is validated through updated emissions results.
Carbon Footprint vs Product Carbon Footprint vs Life Cycle Assessment
These terms are closely related, but they serve different industrial decisions. A corporate carbon footprint is designed for enterprise reporting and target management. A product carbon footprint is designed to quantify emissions for a specific product so you can respond to customer requests and improve design and sourcing choices. Life cycle assessment is a broader framework that can include many environmental impact categories beyond climate, and it is used when you need to evaluate trade offs rather than only CO2e.
Carbon footprint: what it answers and when to use it
A corporate carbon footprint answers the question: “What are the total emissions of this organization over a defined period?” It is the best starting point for industrial companies because it gives leadership a baseline, reveals the balance between Scopes 1, 2, and 3, and helps prioritize where to focus. It is also the format most frequently required for external reporting, financing conversations, and supplier or customer questionnaires that ask for company-level emissions disclosure.
In industrial settings, corporate footprints become more useful when they are broken down by site, energy type, and major procurement categories. A single company total is helpful for a headline number, but it does not tell operations where to act. When emissions are segmented into hotspots, the footprint can guide decisions like which plants to prioritize for heat efficiency programs, which procurement categories need supplier engagement first, and where electricity sourcing choices will have the biggest effect.
Product carbon footprint: what it answers and why customers ask for it
A product carbon footprint answers the question: “How much CO2e is associated with this specific product within a defined boundary?” In industrial supply chains, customers ask for PCFs because they need product-level data to calculate their own footprints and to meet procurement and reporting requirements. A credible PCF can also influence tenders, especially when buyers use sustainability scoring or ask for proof of lower-carbon alternatives.
PCFs are typically more operationally demanding than corporate footprints because they require detailed inputs such as bills of materials, process energy allocation, yield and scrap information, and supplier-specific data for key materials. Many industrial companies start with cradle to gate PCFs because that is where they have the most control and the strongest data access. As customer requirements evolve, some PCFs expand toward cradle to grave, but that usually depends on whether the downstream use phase is material and whether the supplier can credibly model it.
Life cycle assessment: what it adds beyond CO2e
Life cycle assessment is a broader framework that can include climate impact plus other environmental categories such as water use, eutrophication, acidification, and resource depletion. LCA answers the question: “What are the environmental impacts across the life cycle, and what trade offs exist between options?” This is especially important when a change that reduces carbon could increase another impact category. For example, a material substitution might lower CO2e but increase water consumption or toxicity concerns, depending on the supply chain and processing routes.
In industry, LCA is often used by R and D and product strategy teams when evaluating new designs, new materials, new manufacturing routes, or circularity strategies. Compared to a PCF, an LCA typically requires more data, more modeling assumptions, and more methodological decisions. That does not make it less valuable, but it does mean it is usually applied selectively to key products, major redesigns, or strategic questions rather than to every SKU at high frequency.
How Carbon Footprints Are Measured
Carbon accounting is about boundaries, data quality, and consistency. Industrial companies often struggle not because the concept is hard, but because their data lives in many systems and because the underlying business is complex. A robust approach defines what is included, uses repeatable calculation logic, and creates an audit-ready trail from source data to reported results.
Organizational and operational boundaries
The first step is to define the organizational boundary, meaning which subsidiaries, sites, and joint ventures are included. Many industrial groups operate across multiple legal entities, and different consolidation approaches can change totals. The next step is to define the operational boundary, meaning which emissions sources are included in Scope 1, 2, and 3, and how categories are interpreted. This matters because omissions and inconsistent boundaries are the fastest way to lose credibility, especially when customers compare suppliers or when internal performance is tracked year over year.
Once boundaries are set, results should be segmented in ways that reflect how the business runs. For example, a site-level view helps plant managers see what they can influence. A category-level view highlights whether energy, materials, or logistics dominates the footprint. A supplier-level view enables procurement to prioritize engagement where it matters most. Without this operational mapping, a footprint can look complete on paper while still being difficult to act on.
Data inputs, emission factors, and primary data
Industrial footprints blend primary data and secondary data. Primary data includes meter readings, fuel purchase records, and process data from production systems. Secondary data includes emission factors, which convert activity data into emissions, such as kg CO2e per kWh or kg CO2e per kg of material. The closer the data is to the real process and supplier, the more accurate and decision-useful the footprint becomes.
For Scope 3 in particular, many companies start with spend-based estimates because they can be calculated quickly from procurement data. That is a reasonable starting point for completeness, but it is often not sufficient for reduction management. To reduce emissions, teams need more granular models based on material quantities, supplier-specific factors, logistics lanes, and product-level structures. Over time, organizations typically move from broad estimates to more specific and actionable calculations, especially for high-impact categories like steel, aluminum, plastics, chemicals, and electronics.
Common pitfalls in carbon accounting
One common problem is mixing inconsistent time periods, such as using partial-year procurement data with full-year energy data. Another is failing to align production and emissions data, which can hide efficiency improvements or make performance look worse when output changes. Industrial operations are also vulnerable to double counting in complex supply chains, especially when both corporate and product-level calculations are done without consistent allocation rules.
A third pitfall is treating carbon accounting as a one-time project. Industrial footprints need repeatability, because the business changes, suppliers change, and customers ask for updates. If the process depends on manual file exchanges and person-specific knowledge, it becomes fragile and expensive. The goal should be an ongoing system that can ingest data from enterprise systems, apply consistent rules, and produce outputs that both decision-makers and auditors can trust.
What Causes a High Carbon Footprint? (The Big Drivers)
The biggest drivers of a high carbon footprint usually come from a combination of energy-intensive operations and carbon-intensive supply chains. While office energy use and employee commuting can matter, they are rarely the dominant sources for manufacturers. The largest sources are typically process heat, electricity for production, and Scope 3 emissions embedded in purchased materials and components. Understanding the main drivers helps leadership avoid spreading effort across low-impact initiatives.
Process heat and fuel combustion in production
Many industrial processes require high-temperature heat for drying, melting, curing, firing, or chemical reactions. When that heat is produced by burning fossil fuels on-site, it often becomes a major Scope 1 contributor. The emissions intensity depends on the fuel type, the efficiency of equipment, and whether waste heat is recovered. Aging boilers, inefficient ovens, compressed air leaks, and poorly optimized process schedules can all inflate the footprint, especially when equipment runs outside of optimal load ranges.
Process heat is often difficult to decarbonize quickly, which is why it is so important to quantify it accurately and separate it by process line or plant. A single site-level number can hide the fact that a small number of lines or assets dominate fuel use. When emissions are mapped to the underlying production drivers, companies can build realistic abatement roadmaps, prioritize retrofits, and identify where electrification, heat recovery, or alternative fuels are most viable.
Electricity consumption and grid emissions intensity
Electricity is central to industrial operations, from motors and pumps to refrigeration, automation, and machining. Scope 2 emissions can be high even in efficient plants if the grid electricity has a high emissions factor. Conversely, a plant may have high electricity consumption but lower CO2e if it operates in a region with a cleaner grid or uses renewable electricity contracts. This makes it essential to track both kWh and CO2e, since reductions can come from efficiency as well as from changes in the electricity supply.
In practice, industrial electricity footprints rise due to continuous operations, oversized equipment, poor power factor management, unplanned downtime, and rework that increases run time. Electricity-related emissions can also be indirectly driven by quality and maintenance issues. When equipment is poorly maintained, energy use per unit can climb quietly over months. Linking energy data to production volume, downtime, and quality metrics helps teams spot these patterns and improve both cost and emissions performance.
Carbon-intensive materials and supplier manufacturing
For many manufacturers, the largest share of emissions is embedded in purchased goods and services. Materials like steel, aluminum, cement, plastics, chemicals, and semiconductors can carry substantial upstream emissions from extraction, refining, and energy-intensive production. These emissions often dominate Scope 3 and can exceed the combined emissions of all company sites. This is why industrial footprints can look “high” even when factories are efficient. The footprint is frequently a reflection of the product’s material makeup and the supplier base.
The challenge is that upstream emissions are not visible without supplier engagement and product-level modeling. Two suppliers selling the “same” material can have very different emissions profiles depending on energy mix, recycled content, process technology, and facility efficiency. Without supplier-specific data, companies have limited ability to distinguish between reduction strategies such as switching to lower-carbon grades, increasing recycled content, changing suppliers, or redesigning products to use less material.
Logistics, warehousing, and network design
Transportation emissions can be significant, especially for global manufacturers with complex networks. Upstream transport includes inbound shipments of raw materials and components. Downstream transport includes distribution to customers and sometimes returns. Emissions depend on distances, modes, fill rates, packaging, warehousing practices, and the overall network design. A fragmented network can increase miles traveled and reduce load efficiency, while poor planning can drive air freight, which has a much higher emissions intensity than ocean or rail.
Logistics emissions are also connected to operational stability. When production planning is inconsistent, companies may rely on expedited shipping to meet delivery targets. That creates a cycle where quality issues or bottlenecks drive higher emissions. Addressing root causes like forecast quality, inventory positioning, and production reliability can reduce logistics emissions while improving service levels.
Scrap, rework, and yield losses that inflate emissions
Scrap and rework are often overlooked in footprint discussions, but they can significantly increase emissions per sellable unit. Every scrapped part carries the upstream emissions from materials and the downstream emissions from processing energy, plus additional emissions from disposal and replacement production. In material-intensive industries, yield losses can be a hidden hotspot because they amplify Scope 3 material emissions and Scope 1 and 2 processing emissions at the same time.
Reducing scrap is therefore a high-leverage decarbonization strategy, especially when it is tied to quality systems and process control. When companies calculate emissions per unit and connect that metric to defect rates, they can quantify the climate benefit of quality improvements. This also helps teams justify investments in automation, better metrology, improved tooling, and process optimization using both financial and emissions returns.
How to Reduce Your Carbon Footprint
Industrial decarbonization works best when measurement and execution are tightly linked. Many organizations have good ideas for projects, but struggle to quantify impact, prioritize across sites, and prove progress to customers. The most effective approach is to build a structured system that can identify hotspots, evaluate abatement options, track projects, and produce credible outputs for internal and external stakeholders.
This is where Carbmee is designed to help. Carbmee focuses on enabling industrial companies to measure and manage emissions across corporate and product dimensions, move from estimates to actionable granularity, and maintain a repeatable process that supports reduction delivery. The goal is not only to calculate emissions, but to turn emissions data into decisions, workflows, and verified outcomes.

Establish a reliable baseline and hotspot map with operational detail
Reduction starts with a baseline that is complete enough to guide decisions and consistent enough to track over time. Industrial companies need more than a single total number. They need emissions segmented by site, energy source, major processes, procurement categories, and logistics flows, so the organization can see where the biggest levers actually are. A hotspot map should explain what drives emissions and how those drivers change with output, scrap, and procurement mix.
Carbmee supports this by structuring emissions data in a way that aligns with operational reality. Instead of treating emissions as a reporting-only number, it helps companies link activity data to categories that matter for action, such as plants, product groups, and supplier families. This makes it easier to identify which sites and categories dominate emissions, and it provides a practical foundation for prioritizing interventions that deliver measurable reductions.
Scale Scope 3 transparency through procurement and supplier engagement
Since Scope 3 is often the largest share for manufacturers, decarbonization requires credible visibility into purchased goods and services. The most important shift is moving from broad averages to supplier-specific and material-specific insights for the categories that drive the majority of emissions. This allows procurement teams to focus engagement where it matters, negotiate based on data, and track supplier progress rather than relying on general commitments.
Carbmee helps industrial companies structure Scope 3 categories, connect procurement data to emissions logic, and build a repeatable process for improving data quality. As supplier data becomes available, companies can replace generic factors with more specific information and quantify the effect of supplier switches, specification changes, and recycled-content strategies. This supports both reduction delivery and customer disclosures, which increasingly request evidence of supplier-level improvements.
Create product carbon footprints that are credible and efficient to maintain
Customers increasingly ask for product carbon footprints, especially for parts and materials that feed into regulated or customer-facing supply chains. PCFs are most valuable when they are consistent, comparable, and scalable across many products. If the process is manual, it becomes difficult to keep PCFs updated as bills of materials change, suppliers change, and production routes evolve.
Carbmee helps companies develop PCFs using structured product and process data so that outputs can be generated and updated more efficiently. This enables manufacturers to respond to customer requests with confidence, support low-carbon product strategies, and identify design and sourcing choices that reduce emissions. When PCFs are connected to procurement and production data, the organization can see which material substitutions or supplier changes deliver the largest product-level improvements.
Prioritize and track abatement projects with proof of impact
Industrial decarbonization is implemented through projects, such as efficiency upgrades, electrification, renewable electricity sourcing, process optimization, heat recovery, and scrap reduction initiatives. The challenge is that projects often live in separate systems, making it hard to track progress consistently across plants and teams. Without a structured approach, companies struggle to compare projects, allocate budgets, and demonstrate that reductions are real and sustained.
Carbmee supports abatement management by enabling organizations to connect projects to baseline hotspots and track expected versus realized impact. This makes it easier to build an abatement roadmap that prioritizes the highest-impact actions first and to maintain transparency on progress. Over time, teams can build a portfolio view that shows how operational changes and procurement actions translate into emissions reductions, which is especially valuable for leadership reporting and customer communication.
Build reporting readiness with traceability and audit support
Industrial companies face increasing scrutiny on emissions numbers, methodologies, and data provenance. Customers want consistent PCFs and supporting assumptions. Auditors want traceability from reported figures back to source data. Internal stakeholders want confidence that decisions are based on reliable information rather than shifting estimates.
Carbmee is designed to support repeatability and traceability so that results can be explained and defended. When emissions calculations are linked to structured inputs, and when methodological choices are documented consistently, reporting becomes easier and risk is reduced. This also helps organizations avoid rework each reporting cycle and supports faster responses to customer inquiries, which can be critical in competitive procurement processes.
Turning Measurement Into Industrial Decarbonization
For industrial companies, a carbon footprint is only as valuable as the decisions it enables. The biggest drivers typically sit in process energy, purchased electricity, and especially in carbon-intensive materials and supplier manufacturing. Reducing emissions at scale requires a repeatable system that can move from corporate totals to actionable hotspots, expand Scope 3 transparency, produce credible product carbon footprints, and track the impact of abatement projects over time. If any one of these pieces is missing, teams often end up with reporting that looks complete but does not reliably change procurement, engineering, or operations decisions.
Many approaches fail in industry because they stop at high-level accounting and do not connect emissions to operational reality. Spreadsheets and one-off calculations struggle with multi-site complexity, frequent supplier changes, and evolving bills of materials, which leads to heavy manual effort, inconsistent methodologies, and data that becomes outdated quickly. Without clear traceability, numbers are hard to defend to auditors and customers, and without workflows for prioritizing and managing initiatives, measurement does not translate into measurable reduction.
Carbmee is positioned to bridge that gap by helping manufacturers structure emissions data in a way that supports execution. By organizing emissions by sites, categories, suppliers, and products, it enables hotspot identification that reflects how the business actually runs, so teams can focus on the few materials, suppliers, plants, or processes that drive the majority of emissions. This creates a practical foundation for cross-functional work, aligning sustainability with procurement, engineering, operations, and finance around shared data and clear reduction priorities.
Carbmee is well suited to the areas where industrial decarbonization is hardest and most valuable: Scope 3 and product carbon footprints. It supports a continuous improvement approach where companies can start with available data, then progressively increase granularity and quality as supplier-specific inputs come in. That helps scale supplier engagement and sourcing strategies while enabling consistent, repeatable product carbon footprints across many SKUs, which is increasingly critical for customer requests and commercial competitiveness.
Most importantly, Carbmee supports the shift from reporting to execution by helping organizations track abatement initiatives against hotspots and maintain traceable results over time. This closes the loop between baseline measurement, project selection, and verified impact, making it easier for leadership to invest with confidence and for teams to prove progress credibly. When carbon management becomes operational and continuous, decarbonization becomes part of ongoing performance improvement rather than a one-off initiative.